Q1 2026 · Independent Benchmark Report · United States
Benchmarking CX metrics by industry and brands
Compare NPS, CSAT, and Customer Effort Score across 12 industry categories and 100+ leading brands. Independent primary research, United States, Q1 2026.
Industry-level NPS, CSAT and CES scores for Q1 2026 — United States. Download the full report for brand-level data and quarterly trend comparisons going back to Q1 2025.
📱
New · 2026
Smartphones
Highest NPS of any category (46). Strong loyalty driven by seamless ecosystem integration and hardware quality.
NPS
46
CSAT
84%
CES
86%
💼
New · 2026
Workspace Provider
Second-highest NPS category. Productivity tools rewarded for reliability and cross-platform experience.
NPS
41
CSAT
82%
CES
83%
🎵
New · 2026
Music Streaming
Tied with video streaming at NPS 39. High CSAT driven by personalization and content breadth.
NPS
39
CSAT
85%
CES
86%
📺
New · 2026
Streaming
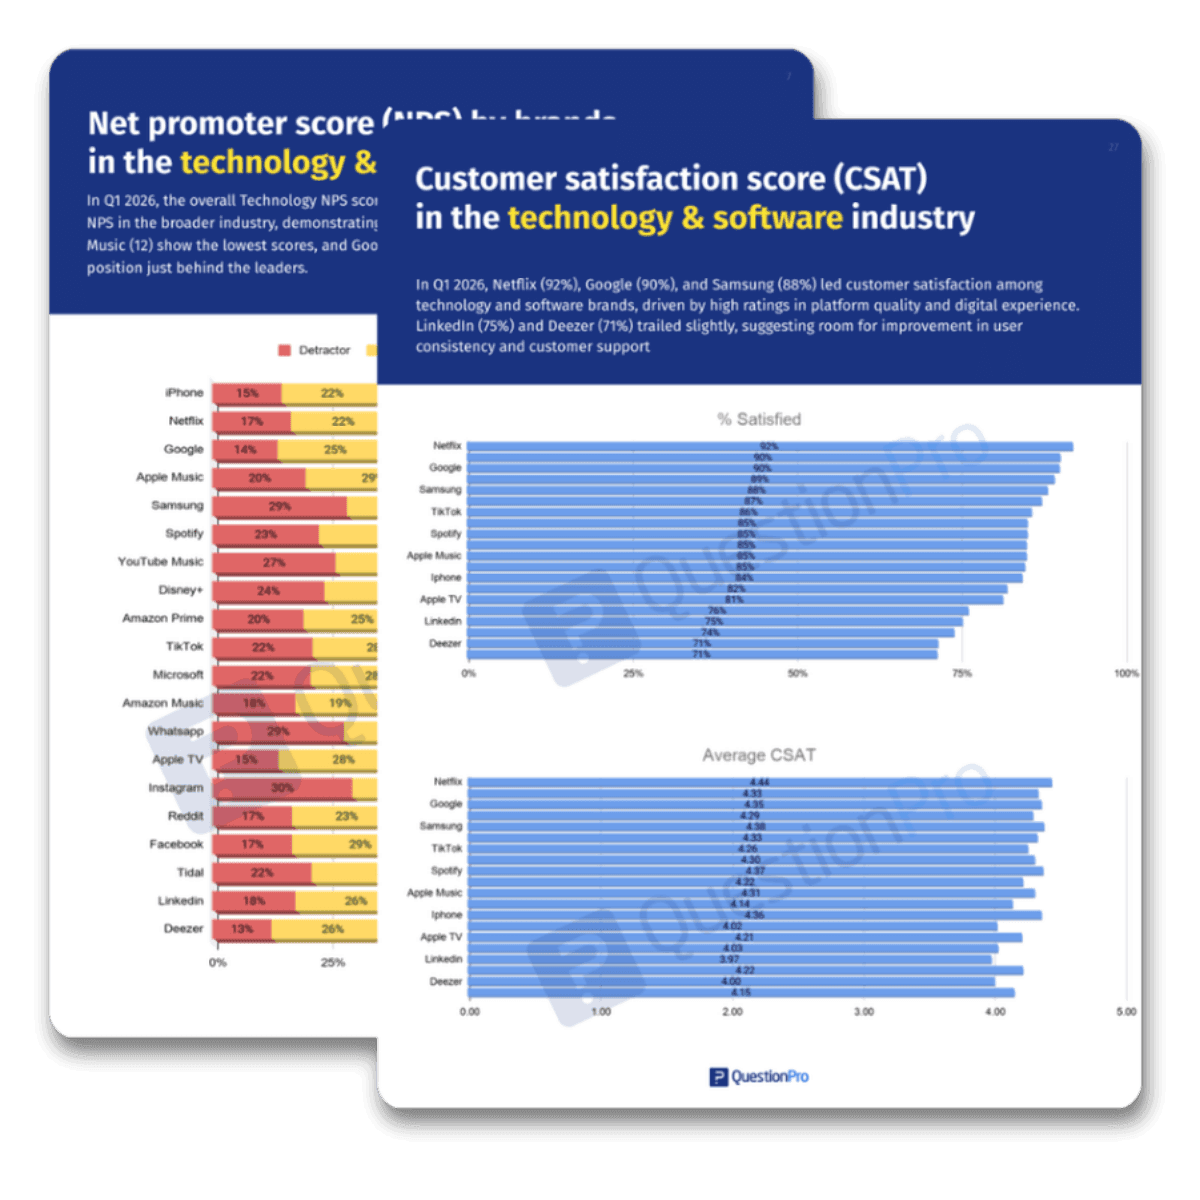
Tied with music streaming. Netflix leads with 92% CSAT and 4.59 CES — highest ease score across all tech.
NPS
39
CSAT
84%
CES
88%
📲
↓ Lowest in Tech
Social Media
Lowest NPS in the Technology group. Privacy concerns, algorithm friction, and monetization drive detractors.
NPS
22
CSAT
75%
CES
82%
🛒
↑ vs Q4
Grocery Retail
Post-holiday recovery. Costco (NPS 64), H-E-B and Trader Joe's lead with strong CSAT gains.
NPS
35
CSAT
77%
CES
82%
🏬
↑ vs Q4
Big Box Retail
Omnichannel leaders see strong recovery. Best Buy rebounds sharply from Q4 lows (NPS 11 → 48).
NPS
35
CSAT
80%
CES
79%
🚗
↑ Major rebound
Automotive
Biggest NPS rebound of the quarter — surged from 12 in Q4 2025 to 32. GMC and BMW lead at NPS 61.
NPS
32
CSAT
75%
CES
77%
🏨
↓ vs Q4 & Q1 2025
Hotel & Hospitality
NPS fell 11 pts vs Q4, 17 pts vs Q1 2025 — despite CSAT holding at 80%. Rate hikes and loyalty devaluation hurt scores.
NPS
27
CSAT
80%
CES
85%
✈️
↑ vs Q4
Airlines
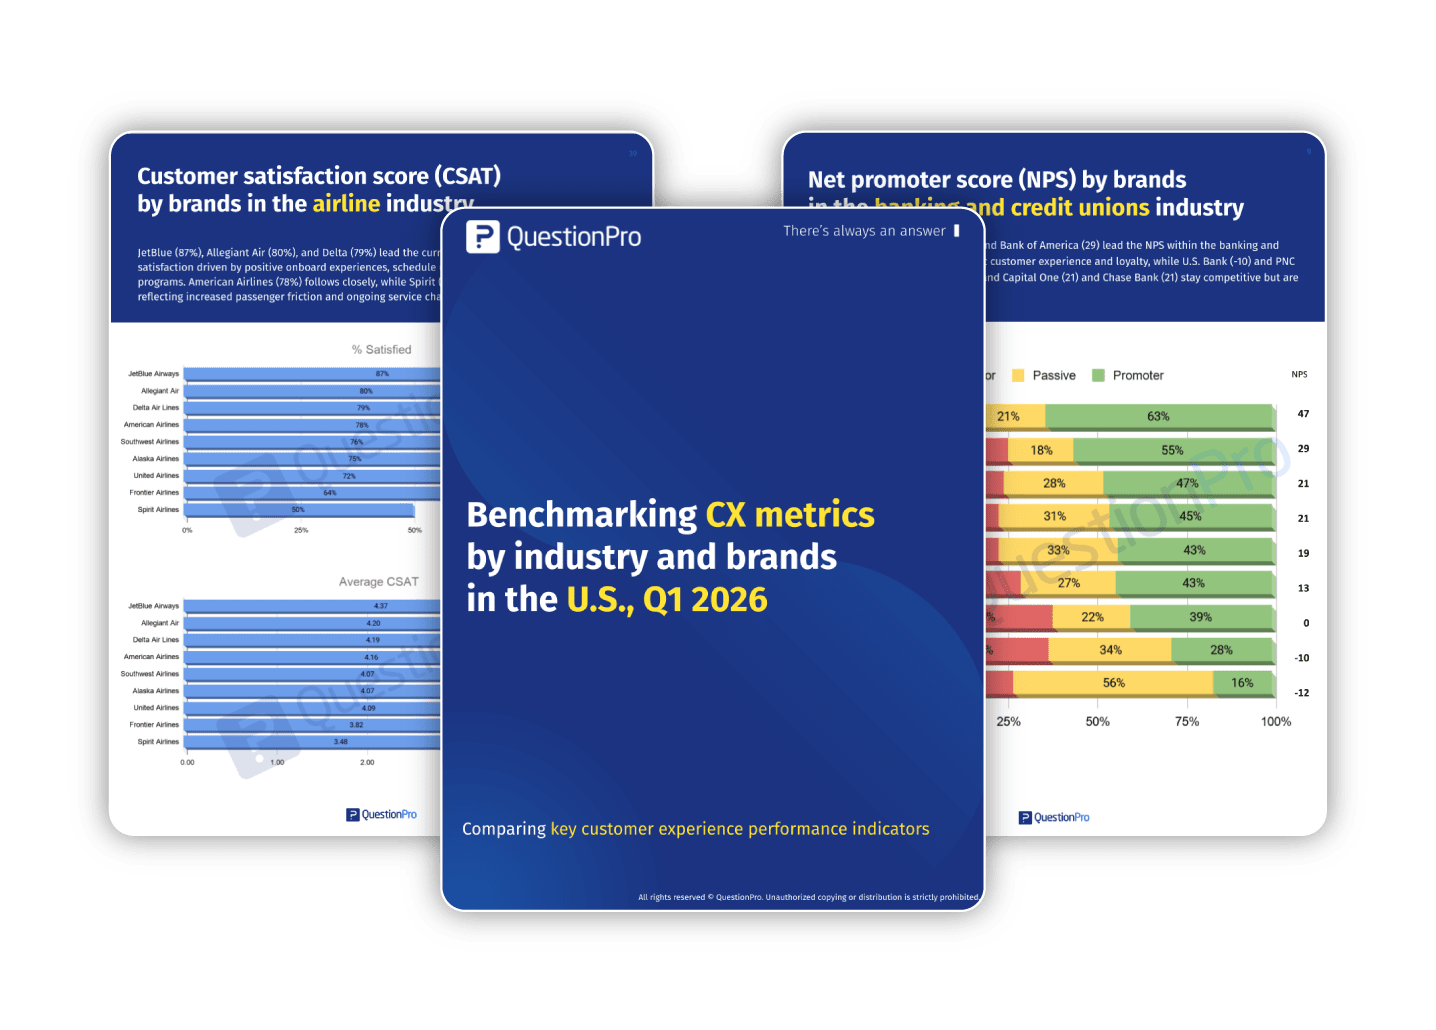
JetBlue leads at NPS 52. Southwest drops sharply (34 → 16) following policy and baggage fee changes.
NPS
25
CSAT
75%
CES
78%
🛡️️️
Stabilizing
Insurance
Q3 2025 peaks have normalized. Farmers Insurance leads (NPS 35). Liberty Mutual posts -15, lowest in sector.
NPS
22
CSAT
74%
CES
76%
🏦
↓ 2nd consecutive decline
Banking & Credit Unions
Second consecutive NPS decline. Local credit unions (NPS 47) far outperform national banks. U.S. Bank posts -10.
NPS
19
CSAT
72%
CES
76%
Methodology
The survey was conducted online via the QuestionPro Audience platform in March 2026. A total of 1,200 U.S.-based respondents completed the survey. All participants were 18 years or older and involved in household purchasing decisions for products and services on their own or with others. The Technology sector was added as a new category in Q1 2026, comprising five subcategories: Smartphones, Workspace Providers, Music Streaming, Streaming, and Social Media. Customer Effort Score (CES) replaced Likelihood of Repurchase to provide a more holistic view of experiences across the customer journey.
The numbers
1,200
Sample size
U.S.A.
Country
Adults 18+
Audience
Web interviews
Mode
Margin of error
The margin of error represents the possible variation that can occur when data is collected through survey sampling. It indicates how much the findings might differ from the true values in the overall population. In contrast, a confidence interval provides a range within which we can reasonably expect the actual value to fall, based on the data gathered.
For this study, with a 95% confidence level and a sample size of 1,200, the margin of error is ±2.83%.
Net Promoter Score · Q1 2026
Top brand NPS rankings
Top-ranked brands by NPS across all 12 industry categories. Download the full report for all 100+ brands and quarterly trend data since Q1 2025.
NPS, CSAT & CES · 100+ brands · quarterly trends since Q1 2025
Free report · Q1 2026 · United States
Get brand-level scores for every industry
The full report includes individual NPS, CSAT, and CES rankings for 100+ brands across 12 industry categories with quarterly trend data going back to Q1 2025.
What's inside the full report
NPS, CSAT & CES for 100+ brands
Quarterly trend data since Q1 2025
Root cause insights per sector
12 industry categories covered
Brand vs. brand comparisons
Download the Q1 2026 report
See how other CX teams in your industry are moving the needle
30 minutes to talk through where your program stands and how teams like yours are using data to close the gap.
?
Compare your NPS, CSAT, and CES scores against your industry's Q1 2026 benchmarks
?
Find out which gaps in your VoC program other teams are prioritizing right now
?️
Get a clear picture of what closing the feedback loop looks like in practice
No pitch, just a real conversation with our CX team to get a clearer picture of where to start.
Book a free 30-min call with our CX team
30 minutes · Google Meet · Pick a time that works for you
 Survey Software
Easy to use and accessible for everyone. Design, send and analyze online surveys.
Survey Software
Easy to use and accessible for everyone. Design, send and analyze online surveys.
 Research Suite
A suite of enterprise-grade research tools for market research professionals.
Research Suite
A suite of enterprise-grade research tools for market research professionals.
 Customer Experience
Experiences change the world. Deliver the best with our CX management software.
Customer Experience
Experiences change the world. Deliver the best with our CX management software.
 Employee Experience
Create the best employee experience and act on real-time data from end to end.
Employee Experience
Create the best employee experience and act on real-time data from end to end.